Picture walking into your boss’s meeting with a report showing organic traffic rising 15% in a quarter, then you’re asked why walk-in traffic didn’t rise with it. This kind of situation likely occurs when you suggest your SEO is succeeding, but your boss disagrees because she doesn’t see any business results.
For a cafe, SEO is measured by layers of visibility, engagement, and business outcomes.
I assess visibility by looking at Google Search Engine Results Page (SERP), reports from Google Search Console (GSC) and sometimes tools like Ahrefs. While engagement is also checked by GSC, accompanied by Google Analytics 4 (GA4). Ultimately, business outcomes are measured by distinguishing specific queries in the GSC traffic report and linking the GA4 conversion report to business values.
Without connecting these three layers, each number that we show becomes meaningless. By giving a proper framework in SEO measurement, our work becomes a story that can defend our strategy.
Revenue Framework for Search Impact
SEO performance of a cafe should be measured not just by engagement, but by starting with its visibility layer and then progressing through layers of engagement and revenue outcomes. Today, there are three types of key performance indicators (KPIs) we can set for a cafe website: core fundamentals, AI visibility, and business impact. Tracking these three KPIs tends to position them more effectively in answering the boss’s questions.
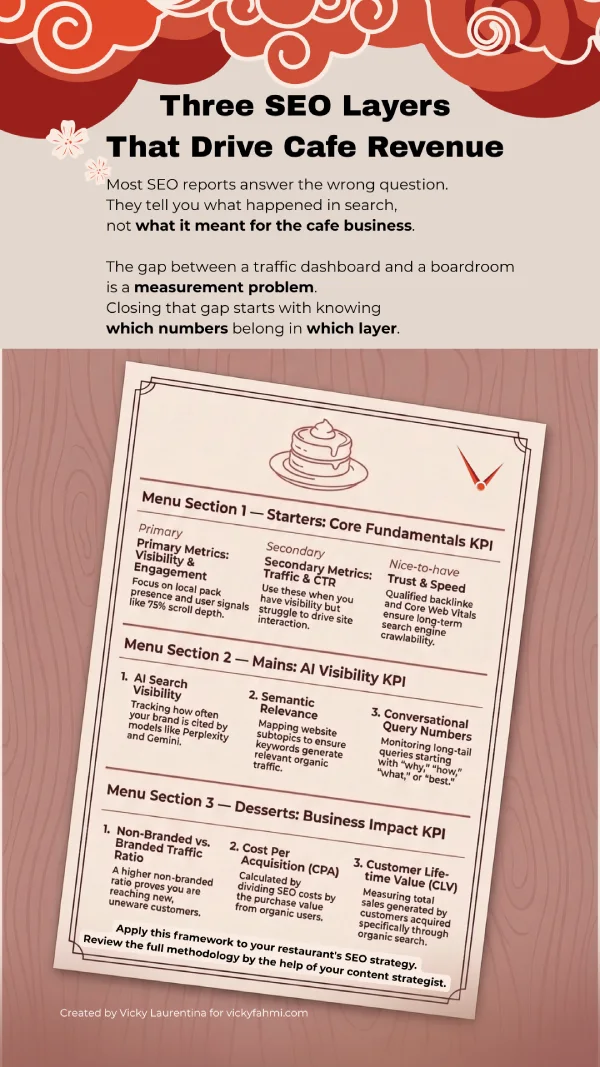
Core Fundamentals KPI
This kind of KPI can be:
Primary:
- Search visibility. The signals are present in certain panels in Google Search Engine Page Results (SERP), such as the local pack, People Also Ask, or simply being featured on the first page in any search engine.
- Engagement. This signals that the organic audience is interested in our website. What I consider as engagement is average time on page, scrolling to 75% and clicking any links on the page.
Secondary, if our condition hasn’t been possible to reach the primary KPI:
- Organic traffic. I usually define “Session” from “Organic Search” in GA4 as SEO traffic. But some agencies probably mark traffic as “Users” to predict business impact KPIs more accurately.
- Click-through rate (CTR). This metric is usually preferred when a website has just gained visibility from SEO but still struggles to drive engagement from search engine users.
Nice-to-have:
- Backlinks. Some businesses believe that getting backlinks from other websites means that their businesses are trusted. But to set increased backlinks as a KPI, I suggest you only select backlinks from qualified websites.
- Core Web Vital score. Usually, this metric is set as a KPI for websites which still struggle to optimise their loading speed. Pages with low speed tend to be rendered slowly by search engines, so they technically fail SEO.
AI Visibility KPI
This type of KPI measures how your website is recognised and cited by conversational engines and search systems that have been powered by AI. Tracking these KPIs helps connect the search visibility with tangible performance metrics. The following indicators have been sorted from the easiest to access:
| KPI Name | How I Measure It |
| AI search visibility | Track monthly using Ahrefs |
| Semantic relevance | Map the website’s subtopics and identify which subtopic keywords produce organic sessions |
| Conversational query numbers | Extract question-based queries from the GSC Performance report |
These KPIs matter because they connect recognition within search systems to measurable outcomes. Any high scores indicate that my content has not just emerged in AI channels, but also contributed to engagement and business results.
Business Impact KPI
These indicators are usually the ones most questioned by your cafe’s owner, because they’re most closely linked to the business outcome. Below are the examples, again sorted based on the easiest to assess:
- Traffic ratio between non-branded and branded queries. Higher organic traffic from non-branded queries than the organic traffic from branded ones indicates that your cafe brand’s name has been recognised by people who previously didn’t know that your cafe exists.
- Cost per acquisition. It’s calculated by dividing the SEO cost by the purchase value generated by organic users.
- Customer lifetime value. It measures the total sales generated by customers acquired through organic search, since they already know your cafe’s brand.
There were days when I ignored this kind of KPI, thinking my task was just to create traffic or generate the most leads from organic search.
Ignoring business-impact KPIs prevented me from explaining why high traffic from low-intent keywords was misaligned with stagnant conversion, which made SEO not sound like it worked for clients who need to make decisions.
Vicky Laurentina, 2026
Operational Workflow with Analytics Platforms
To create a reliable measurement in SEO, it needs a diagnostic tool combined with another (or in my case, two) tools for behavioural tracking. This is why GSC is needed to complement GA4 in measuring SEO success. The following workflow will provide you with a structured approach to create meaningful insight for your cafe owners.
Diagnostic Indicators of GSC
GSC serves as a diagnostic tool on our website, showing what drives organic visitors and what doesn’t. It explains SEO issues your website probably has, such as crawlability or indexability failures, and a mismatch with your audience’s search intent. You’ll need this if your cafe has plenty of branches or products, each with its own landing page, and it overwhelms you to check which pages haven’t generated conversions.
This is my procedure to measure visibility and engagement for SEO in GSC:
- Assess Performance > Filter: 28 days > Tab: Page > Total Impressions. This measures how many of my landing pages appear in the Google SERP, and the Top Pages column shows which pages are most visible.
More > Tab: Compare > Compare current 28 days with previous period. This measures whether my pages are visible more frequently or not than in the previous month. If your cafe has branches, you should check whether each branch’s landing page has been visible enough during this period, or is even being seen more than in the previous period. - Check Average Position. I check this metric to confirm a landing page’s invisibility if I find it hasn’t got enough impressions. Any pages ranked after position 11 are considered invisible, and they risk my brand losing visibility in Google.
For example, your cafe offers a speciality menu unique to the city, such as fuwa fuwa pancake. To determine if this pancake has been visible enough online, check its landing page’s rank to ensure it has reached rank 1-10. This is how you link the metric directly to your SEO performance. - Find the Average CTR. This metric is used to filter landing pages ranked 1-10 that have a CTR below 19%. These pages appear irrelevant to Google users, making them less confident to interact with our site and reducing engagement.
For instance, your landing page, fuwa fuwa pancake, has ranked in seventh position, but its CTR is just 18%. The incoming query showed in the GSC is ”what is fuwa fuwa pancake”. The low CTR indicates that the incoming query hasn’t driven SERP visitors to act on your link, suggesting they don’t understand why they should eat this menu. - Examine URL Inspection. I use this column to check if any landing pages haven’t got impressions or position today. If any indexability or crawlability issues arise, this will explain why these pages lose visibility on Google. This will matter to you if your landing pages are invisible in Google, even though they are designed to drive conversions, such as pages about a product or service.
- Assess Indexing > Pages. Scrutinise any issue signed as crawled – currently not indexed, discovered – currently not indexed, or even worse: not found [404]. Any conversion-intended pages with this status can explain why your SEO hasn’t delivered a business outcome.
- Check Indexing > Sitemap. Ensure your sitemap has been submitted and has a Success status. Submitting an image sitemap will benefit your cafe because people tend to engage more with culinary content in image form, and search engines understand a website’s images better when they’re in a sitemap.
- Access Manual Actions and Security > Settings > Crawl Statistics. I just checked this to see if there’s no organic traffic at all in a day. This menu can detect any drop in crawling, which is a sign that there’s a problem with my hosting in handling its server and hurting my website’s visibility.
Step-Based Measurement in GA4
I use GA4 as a hub to connect website users’ behaviour with the business outcomes behind the website. By configuring it, I can identify which landing page on the website is actually driving conversions and which has been visited many times but misses conversion opportunities.
Measuring SEO performance in GA4:
- Define conversion events.
Pick up menu Admin > column: Data display > Events. Mark actions you think are critical, such as tapping the Order button (to order from the menu) or the Submit button (usually to book a table).
When my website was still struggling to generate leads, I simplified events such as Scroll 75 and Scroll 50. - State the conversion value.
For example, if a portion of puwa puwa pancake costs AUD 4, you can enter 4 in the value box. If a cup of hojicha latte costs AUD 1.50, fill the box that much.
- Assess acquired organic search users.
Tap menu Reports > submenu: Acquisition > submenu: Traffic Acquisition > row: Organic Search > column: Session. This is where I assess how many visitors come to my website from search engines.
- Check acquired users from AI models.
Tap menu Reports > submenu: Acquisition > submenu: Traffic Acquisition > row: Referral > + > Traffic Source > Session source. Find out which AI models have given you traffic, like chatgpt.com, gemini.google.com, and so on.
This is how visibility in an AI-powered search system has turned into traffic. - Examining the acquired conversion.
Choose column Event count > tap an arrow All events > pick up the Event that we have marked at the first point. This is how we recognise the extent to which our SEO has contributed to the website’s engagement.
- Locate the column of Total revenue.
This column shows how much SEO have created business outcomes.
- Find which landing page drives the most conversions.
Tap menu Reports > submenu: Acquisition > submenu: Traffic Acquisition > row: Organic Search > column: Page / screen > Page path and screen class > column: Session. We can see here which product is seen most.
Assess the column of Total conversion. We can see why one of your products is sold and why the other isn’t sold much, though it’s probably seen a lot. - Find which article leads to conversion.
This is necessary if your website also has articles to create awareness about your products or services. I use this step to measure if the article has created engagement.
Assess column Average engagement time per session > choose column Event count > tap an arrow All events > pick up event Scroll.
So if your boss asks why you keep hiring writers to craft articles, you can answer that people have been engaged with your articles, and the engagement attracts them to order your pancake.
Performance Benchmarks and ROI Signals
Each industry faces different SEO challenges because practitioners and demand aren’t always in equal supply. For example, it’s natural to get low traffic if your cafe’s products are trendy, but your cafe is located in a town dominated by elderly residents. This is where marketers need benchmarks, because they provide leaders with the raw context to decide whether their SEO has worked or still needs improvement.
Below are the relevant benchmarks for a cafe website:
Local search visibility. Most traffic to cafes comes from on-foot customers, defined as those living within 5 kilometres of the cafe’s location. Your benchmark is being able to be found for any queries related to your product that end with “near me”.
For example, your fuwa fuwa pancake should be findable if people five kilometres distant are typing ”fuwa fuwa pancake near me”. A digital marketer, Adam Bocik, wrote on his website last year, ”A restaurant might find that 80% of their organic traffic comes from mobile users within 10 miles.”
Competitor benchmark. This competitor can be any vendor that offers the same products or services as yours. The benchmark should be to get good reviews on Google Business Profile as many as your competitor, defined as 4.5 stars.
Another benchmark to compare against your competitor is the share of voice in non-branded keywords. For example, when your cafe’s brand mentions outnumber your competitor’s when people discuss fuwa fuwa pancake, you can assume that you have passed the benchmark.
Branded search volume. This happens when there was previously no keyword with search volume that mentioned your brand, but now people are searching for you in significant numbers.
The keywords are not just ”Cafe XXX”, but also ”where to park around Cafe XXX”, which suggests a request to visit your business site. Or, ”how much is fuwa fuwa pancake in Cafe XXX”, which suggests a demand to buy your product.
New non-branded queries. This can apply if your cafe chain has just opened a new branch in a city where locals haven’t recognised your brand. If there’s a non-branded query that creates clicks to your landing page about the new branch, it can be assumed that your branch’s recognition has emerged in the city.
Measuring SEO performance requires time and energy, so the cafe business should include the cost of this activity. The SEO cost can include many factors, and stakeholders certainly want to know how much it will cost and what return it will deliver for their business.
ROI = [(Revenue from Organic Search – Total SEO Cost) ÷ Total SEO Cost] × 100.
Total SEO cost can be influenced by cost of measurement analysing time the measurement, + cost of hiring food writers and visual designers + cost of technical development for the website + cost of a tool subscription + cost for hiring agency/freelancers.
Measuring SEO performance can’t be done in days or weeks because SEO takes time to process, from crawling the website’s content to delivering business outcomes. It’s natural that, in a quarter, SEO still yields minimal ROI because the strategic foundation is being established. But after that, if you measure the SEO framework correctly, ROI becomes visible.
”SEO compounds over time—expect minimal ROI months 1-3, breakeven months 4-6, and strong positive returns from month 7+.” (Paine, 2026)
Working with a content strategist who understands SEO can lead to significant improvements.
As a strategist, I can plan content to attract your target audience, then categorise it to prioritise it for search engines. Not just writing, but I can also set the right code to optimise the contents’ crawlability and indexability, which will be the foundation for its visibility in search systems and AI. I can even measure each layer of your SEO to assess whether it faces issues with visibility, engagement, or conversions.
If you’re responsible for defending your SEO investment inside a cafe or any other restaurant genre, and you need a clearer view of how SEO brings traffic to your business, find the answer on my profile page. My approach connects search visibility to better revenue outcomes.
This article was published on October 5th, 2025, but was updated on March 14th, 2026, to give you the latest insights.

I am an SEO specialist with experience as a content strategist. I blog about planning and optimising content for marketing insights. See my profile page to find out more about me. Follow me on LinkedIn and Instagram.
I really shocked after read first paragraph. The purpose of SEO is to gaining customer. So, if they only see cafe’s website without a plan to eat/drink at that cafe, the SEO doesn’t work well.
Now I want to learn about data analysis….
Yes, you’re absolutely right that SEO should attract real customers. If you’re starting to explore data analysis, that’s the secret sauce to spotting which of those views eventually turn into diners.